![]() Jun 10
Jun 10

Price Elasticity
Concept
The concept of price elasticity is pretty easy to grasp.
In economics, it is a measure of how sensitive demand or supply is to price.
In marketing, it is how sensitive consumers are to a change in price of a product.
There are many determinant of elasticity that are both supply-side and demand-side. Nevertheless we can distinguish two types of price elasticity:
Own price elasticity: changes in demand of a single product due to its price
Cross price elasticity: with changes in demand of one product due to changes in price of another.
Understanding elasticity allows us to identify the optimal point for revenue – since we have reducing marginal returns on price increments. Graphically the optimal point lies at the frontier of the Price vs. Quantity graph depicted below:

Own Price Elasticity

Imagine you were going to buy an apple from the local market where there are only 100 apples and 100 customers including yourself. The price of apples on the day is $2 and every person can only buy 1 apple.
At a price of $2 perhaps 80 people would be willing and able to buy an apple at the $2. If the price of an apple suddenly became $100 per apple, chances are no one would be willing and/or able to buy an apple. At a price lower than $2 we might see a few more people buying apples, or none at all.
The same dynamic applies to quantities where a drop or rise in the availability of apples would impact how much people are able and willing to pay for a product.
We therefore arrive at the formula for price elasticity of demand is given by either of the following:
- PE = (ΔQ/Q) / (ΔP/P)
- PE = (ΔQ/ΔP) * (P/Q)
- P is price
- Q is quantity
- ΔQ is the change in quantity
- ΔP is the change in price
Let us look at an example.
Imagine you are a sales person in the market and you sell apples .. green shiny ones that makes people’s mouths water with delight. You currently sell like everyone else in the market an apple for $2 and sell 100 apples each day.
You want to sell more and therefore you decide to play the price game (…bad idea, but that’s for another post…) and cut the price to $1.99 (…nice move, sales person, nice move…). The next day rolls over and you end up selling 110 apples.
How elastic is demand?
It’s 20 … but what does that mean?
It means for every percentage drop in price, you get 20 percent increase in quantity.
Elasticity Interpretation
Generally, we can interpret price elasticity values with the following ranges:
- PE equal to 0: Perfectly inelastic demand – meaning that price has no impact on quantity.
- PE between -1 and 1: Relatively inelastic demand
- PE larger than 1: Changes in price impact demand in opposite direction.
- PE less than -1: Changes in price impact demand in the same direction.
Cross Price Elasticity

Imagine you grew your business and now own an entire supermarket.
You now sell apples, juice, eggs, flour, cookies and all sorts of great products!
You start thinking about the pricing strategy of your products and you set prices for each product. You notice that changing the price of eggs impacts sales (as it should do!). You start to do the elasticity calculations and you realize that increasing the price of flour reduces sales not only in flour, but also in eggs. Another oddity is that eggs sales pick up slightly when you increase the price of cookies.
Soon you realise that the changes you make in the price of flour impact that changes in quantities sold of eggs. Likewise, the increase in price of cookies impacts the sales of eggs. People start making their own cookies rather than buying them ready made if they are too expensive!
This is called cross price elasticity and is calculated as follows:
- CPEeggs,cookies = (%ΔQeggs / %ΔPcookies)
We calculate %ΔQ and %ΔP as follows:
- %ΔQ = Qstart – Qend / (Qstart + Qend) ÷ 2
- %ΔP = Pstart – Pend / (Pstart + Pend) ÷ 2
Lets take a look at an example. Suppose that you had cookies priced at $5 and eggs at $2 selling 100 units and 50 units respectively. You decided to increase the price of cookies because they are awesome and stuff to $8! Your customers are angry cookie monsters and you only manage to sell 10 cookies after the price hike. On the other hand, your egg sales fly through the roof at 100 units. It seems like many cookie monsters decided to bake at home.
We would then get CPEeggs,cookies = %ΔQeggs / %ΔPcookies = (~33%) / (~23%)
This gives a CPE of 1.44 … but what does this mean?
The positive relationship between eggs and cookies indicate that they are good substitutes for one another. That a change in price of eggs by one percent increases the sales of cookies by 1.44. If the relationship was negative, they would be complements to one another.
Next Steps
We now know that elasticity tells us about how sensitive our customers are to the price of one product or the relative price of another. We can use this information provided historical data, but as the adage goes: hindsight is 20-20.
The next step would be to be able to predict or model the relationship between quantity and price and determine elasticity. This should start to sound familiar if you have had any experience with regression modelling. A regression model would take the form of:
- Quantityeggs = A x Priceeggs + B x Pricecookies + e
Where A and B are some coefficient and e is a constant.
We would then have the predicted relationship between quantity and the price of each product in our supermarket. Calculating price elasticity and cross price elasticity then becomes relatively easy.
This is precisely what we will do with R in the next post on Price Elasticity with R!
![]() Posted by Salem
Posted by Salem
![]() Oct 21
Oct 21

The Swiss Cheese Model

The Swiss Cheese Model by James Reason
The Swiss Cheese Model is one which describes accident causation as a series of events which must occur in a specific order and manner for an accident to occur. A stack of unique individual slices of cheese is analogous to an organisational system – where each layer contains a gap.
Accidents occur when a process falls through each of the gaps in each layer – described by the transformation of hazards to accidents. There are two types of gaps – latent and active failures. Latent gaps are existing problems inherent in the system, and active ones are the acute failures that lead to an accident.
This model is useful in tracking root causes for failures and help in identifying risks before they become issues.
“Quality is never an accident; it is always the result of intelligent effort.†~ John Ruskin
Oh and the inventor of this approach is a University of Manchester graduate … ahem ahem …
This model is from The Decision Book. Please make sure to visit 50 Top Models – the author’s website. If you like what you see, buy the book! Support the author and awesome content.
![]() Posted by Salem
Posted by Salem
![]() Oct 20
Oct 20
The Personal Performance Model

Personal Performance Model
The personal performance model is one that needs to be used like a survey – for a period of three weeks, fill this model rating each category (three of them) on a scale of 0 – 10. To do this, every day rate your tasks (as a group) by answering the following questions:
Want to: To what extent does this role correspond to what I want to do
Have to: To what extent is this role imposed on me?
Able to: To what extent do my tasks match my abilities?
The results
Once the three weeks are done, look at your maps.
- If your map changes constantly, then you have a good variety of tasks.
- If your stays the same, then you need to ask yourself are you being challenge enough? Where can you improve?
This model is from The Decision Book. Please make sure to visit 50 Top Models – the author’s website. If you like what you see, buy the book! Support the author and awesome content.
![]() Oct 18
Oct 18
The Supermemo Model

How do you remember everything?
How do you go about remembering all the information you get and want to keep … and how do you keep it in memory for a long time?
Long term memory has two components: retrievability and stability. In other words, how close is the memory to our consciousness and how deeply engrained is the information from that memory.
Here is an example of retrievability:
Look at this number 2,348,129 now look away and try to remember the number in order. Not too difficult, especially if you cheat a little.
Now try to remember the room number of the hotel you stayed at last year … go on, it’s a much shorter number … not so memorable? If it is, try the year before that, and before that, and so on.
As far as stability is concerned:
Remember of something personal. Anything you can remember from your childhood is stable information. What are the first four digits of Ï€? If you’re not a mathematician, what does a cookie remind you of? Cookie monster? It’s deeply anchored in your mind.
The Supermemo Model is concerned with transforming retrievable memories into stable memories by tracking how often you forget a memory you want to remember. Every time you forget the memory, remind yourself – the intervals of forgetting will become farther apart, and you will exercise your brain to remember something longer!
It’s not what you know, it’s what you remember ~ Jan Cox”
This model is from The Decision Book. Please make sure to visit 50 Top Models – the author’s website. If you like what you see, buy the book! Support the author and awesome content.
![]() Posted by Salem
Posted by Salem
![]() Oct 17
Oct 17
What makes you Happy?

How Happy Are You?
At some point, we all fall to one of two misfortunes:
- Being tasked with a monstrous and seemingly impossible job.
- Hitting ourselves over the head with a blunt object hoping that an excruciatingly boring job comes to an end
Somewhere in between those two lies a dynamic sweet spot; always keeping you on your toes as it changes place.
Where does your sweet spot lie? It’s when you are:
Intensely focused on an activity of your own choosing, that is neither under challenging (boreout) nor over challenging (burn out), that has a clear objective, and that receives immediate feedback.
Can you think of a time when you hit your sweet spot?
This model is from The Decision Book. Please make sure to visit 50 Top Models – the author’s website. If you like what you see, buy the book! Support the author and awesome content.
![]() Posted by Salem
Posted by Salem
![]() Oct 11
Oct 11
Hersey-Blanchard Model

Hersey-Blanchard Model for Situational Leadership
The Hersey-Blanchard Model is a tool to manage and direct people based on situational factors. The model consists of two parts: a process (top) and a matrix (graph).
The matrix is a tool designed for leaders and reads from right to left starting with S1 (Situation 1: Directing) to S4 (Situation 4: Delegating). The process follows each situation describing the state of direct reports (or followers if you will).
Directing: is concerned with instructing highly committed people who have yet to develop the necessary set of skills to execute tasks. At this stage, direct reports are attributed with high commitment and low competence.
Coaching: Despite rising competence, the levels of commitment have fallen – leaders are required to increase their supportive behaviour by asking challenging questions and allowing direct reports to solve problems.
Supporting: Employees in this stage have high levels of competence and varying commitment levels – they may resign – and leaders have to increase their supportive behaviour; focusing less on directing reports.
Delegating: Employees are highly competent and in control of their own projects. These employees can lead their own teams and develop them in a similar fashion.
Have a think about where you sit – in both parts of the models. Use the model to successfully navigate from one end to the next. The reservation I have about this model is that it is very linear and fails to describe fall back strategies.
This model is from The Decision Book. Please make sure to visit 50 Top Models – the author’s website. If you like what you see, buy the book! Support the author and awesome content.
![]() Posted by Salem
Posted by Salem
![]() Oct 10
Oct 10
How to Turn a Group into a Team

Team Performance Model
The model above was developed by Drexler and Sibbet, founders of The Grove consulting.The model is self explanatory really, so I won’t dive into details.
Follow the steps from 1 – 7 that take you through the stages of creating and sustaining a team. Each stage has outcomes based on failure to resolve or succeeding at overcoming issues of each stage. If you fail to resolve an issue, fall back a stage before proceeding.
This one is going on my wall.
This model is from The Decision Book. Please make sure to visit 50 Top Models – the author’s website. If you like what you see, buy the book! Support the author and awesome content.
![]() Oct 10
Oct 10
Prisoner’s Dilemma

The Prisoner's Dilemma - Source: Britannica.com
The Prisoner’s Dilemma is a classic game theory problem that shows how communication can drastically affect outcomes. The image is self explanatory: two prisoners are offered a deal, if one confesses the other gets 20 years, if none confess both get 1 year, and if both confess they each get 5 years in prison.
Trust makes way for treachery
The best outcome from a statistical point of view is to cooperate and stay silent. The dilemma here is that communication between the two prisoners is cut off; leaving all decisions to trust and chance.
What would you do?
From a leadership and management perspective, you can leverage communications or the lack of them to identify different outcomes. This is especially useful in change efforts to help managers identify different strategies to solve competitive problems through collaboration.
You can’t shake hands with a clenched fist – Gandhi
This model is from The Decision Book. Please make sure to visit 50 Top Models – the author’s website. If you like what you see, buy the book! Support the author and awesome content.
![]() Posted by Salem
Posted by Salem
![]() Oct 10
Oct 10
Appreciative Inquiry Model

Appreciative Inquiry Model
In the early 20th Century, a major development in philosophy took place called the Linguistic Turn. Not to bore you into a state of comatose ~ the linguistic turn is based on the notion that language constitutes reality and is not a transparent medium for thought. In layman’s terms: your language defines the way you see the world.
The appreciative inquiry model is not far off from this notion – it asserts that discussions should focus on positive attributes, strengths, and latent potential rather the weaknesses. The principle behind the model is that everything has faults, and an awareness of this fact sets people on a course to continuously improve and develop towards perfection.
There are four archetypes in this model:
- The fault finder: Destructive positive discourses. “Good idea, but …”
- The dictator: Destructive negative discourses. “No!”
- The school teacher: Constructive negative discourses. “No, this isn’t good because …”
- The Appreciative Inquiry Thinker: Constructive positive discourses. “Yes, and we could also …”
Next time you’re in a meeting, try and identify how each person forms their arguments. What category do you fall into?
This model is from The Decision Book. Please make sure to visit 50 Top Models – the author’s website. If you like what you see, buy the book! Support the author and awesome content.
![]() Posted by Salem
Posted by Salem
![]() Oct 9
Oct 9

Double Loop Learning
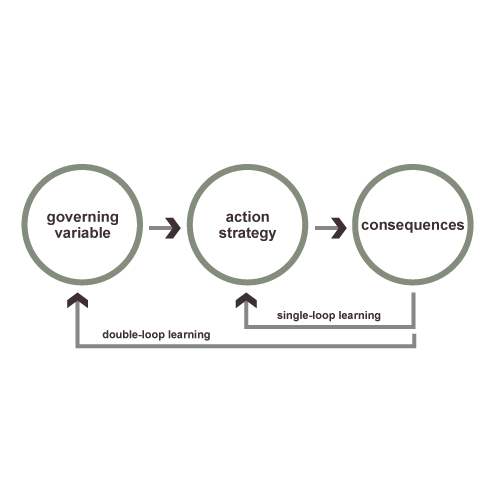

Double Loop Learning
This is probably my favourite model that has roots in organisational behaviour and psychology.
The Single Loop
The first loop involves formulating a strategy, actioning/executing it, and then doing the same provided outcomes from the first iteration of the loop. Note: outcomes might be intended or unintended and can impact the person in the loop or people outside of the loop.
The worst case scenario here is that the same action is repeated over and over and over – producing undesirable outcomes just as many times over.
The Double Loop
The second loop involves a governing variable; a control introduced for observation. The control is then used to adjust the actions and strategies to produce more intended outcomes – or outcomes that match your variable.
To illustrate:
Situation:
It’s your wife’s birthday.
Strategies:
- Buy her a gift
- Buy her an expensive gift
- Buy her a cheap gift
- Don’t buy her a gift
- Eat a cookie
Consequences of each strategy:
- Happy.
- Very happy, but your dog’s hip operation has to wait.
- It’s the thought that counts, and the couch is waiting.
- Have you met the couch yet?
- Happy. She might not be … but you definitely are!
At this point you’re in a single learning loop. A double learning loop would introduce controls, or variables, or values.
Variables
- You love your wife, and hate the couch.
- The dog played a major role in getting you two together.
- You promised you’d take her on a romantic trip on your next anniversary.
- She hates celebrating her birthday because it makes her feel old(er)
You’ll quickly see that introducing controls and matching them with the consequences will almost indisputably change your actions. If you see this, you see the double learning loop.
This model is from The Decision Book. Please make sure to visit 50 Top Models – the author’s website. If you like what you see, buy the book! Support the author and awesome content.

