Collaborative Filtering with R
![]() Posted by Salem on April 26, 2014
Posted by Salem on April 26, 2014
We already looked at Market Basket Analysis with R. Collaborative filtering is another technique that can be used for recommendation.
The underlying concept behind this technique is as follows:
- Assume Person A likes Oranges, and Person B likes Oranges.
- Assume Person A likes Apples.
- Person B is likely to have similar opinions on Apples as A than some other random person.
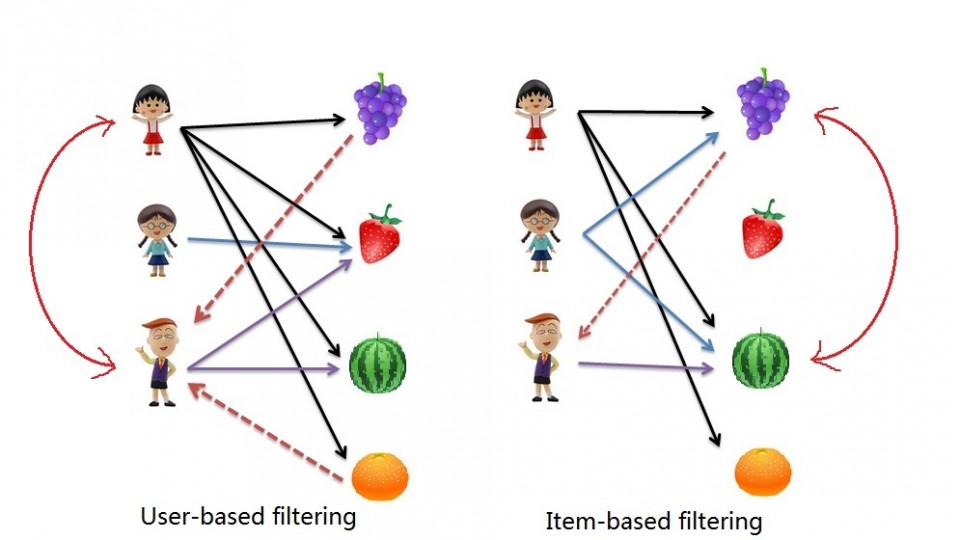
The implications of collaborative filtering are obvious: you can predict and recommend items to users based on preference similarities. There are two types of collaborative filtering: user-based and item-based.
Item Based Collaborative Filtering takes the similarities between items’ consumption history.
User Based Collaborative Filtering considers similarities between user consumption history.
We will look at both types of collaborative filtering using a publicly available dataset from LastFM.
Case: Last.FM Music
The data set contains information about users, their gender, their age, and which artists they have listened to on Last.FM. We will not use the entire dataset. For simplicity’s sake we only use songs in Germany and we will transform the data to a item frequency matrix. This means each row will represent a user, and each column represents and artist. For this we use R’s “reshape” package. This is largely administrative, so we will start with the transformed dataset.
Download the LastFM Germany frequency matrix and put it in your working directory. Load up R and read the data file.
# Read data from Last.FM frequency matrix data.germany <- read.csv(file="lastfm-matrix-germany.csv") |
Lets look at a sample of our data. The output looks something like this:
head(data.germany[,c(1,3:8)]) user abba ac.dc adam.green aerosmith afi air 1 1 0 0 0 0 0 0 2 33 0 0 1 0 0 0 3 42 0 0 0 0 0 0 4 51 0 0 0 0 0 0 5 62 0 0 0 0 0 0 6 75 0 0 0 0 0 0 |
We’re good to go!
Item Based Collaborative Filtering
In item based collaborative filtering we do not really care about the users. So the first thing we should do is drop the user column from our data. This is really easy since it is the first column, but if it was not the first column we would still be able to drop it with the following code:
# Drop any column named "user" data.germany.ibs <- (data.germany[,!(names(data.germany) %in% c("user"))]) |
We then want to calculate the similarity of each song with the rest of the songs. This means that we want to compare each column in our “data.germany.ibs” data set with every other column in the data set. Specifically, we will be comparing what is known as the “Cosine Similarity”.
The cosine similarity, in essence takes the sum product of the first and second column, and divide that by the product of the square root of the sum of squares of each column. (that was a mouth-full!)
The important thing to know is the resulting number represents how “similar” the first column is with the second column. We will use the following helper function to product the Cosine Similarity:
# Create a helper function to calculate the cosine between two vectors getCosine <- function(x,y) { this.cosine <- sum(x*y) / (sqrt(sum(x*x)) * sqrt(sum(y*y))) return(this.cosine) } |
We are now ready to start comparing each of our songs (items). We first need a placeholder to store the results of our cosine similarities. This placeholder will have the songs in both columns and rows:
# Create a placeholder dataframe listing item vs. item data.germany.ibs.similarity <- matrix(NA, nrow=ncol(data.germany.ibs),ncol=ncol(data.germany.ibs),dimnames=list(colnames(data.germany.ibs),colnames(data.germany.ibs))) |
The first 6 items of the empty placeholder will look like this:
a.perfect.circle abba ac.dc adam.green aerosmith afi a.perfect.circle NA NA NA NA NA NA abba NA NA NA NA NA NA ac.dc NA NA NA NA NA NA adam.green NA NA NA NA NA NA aerosmith NA NA NA NA NA NA afi NA NA NA NA NA NA |
Perfect, all that’s left is to loop column by column and calculate the cosine similarities with our helper function, and then put the results into the placeholder data table. That sounds like a pretty straight-forward nested for-loop:
# Lets fill in those empty spaces with cosine similarities # Loop through the columns for(i in 1:ncol(data.germany.ibs)) { # Loop through the columns for each column for(j in 1:ncol(data.germany.ibs)) { # Fill in placeholder with cosine similarities data.germany.ibs.similarity[i,j] <- getCosine(as.matrix(data.germany.ibs[i]),as.matrix(data.germany.ibs[j])) } } # Back to dataframe data.germany.ibs.similarity <- as.data.frame(data.germany.ibs.similarity) |
Note: For loops in R are infernally slow. We use as.matrix() to transform the columns into matrices since matrix operations run a lot faster. We transform the similarity matrix into a data.frame for later processes that we will use.
We have our similarity matrix. Now the question is … so what?
We are now in a position to make recommendations! We look at the top 10 neighbours of each song – those would be the recommendations we make to people listening to those songs.
We start off by creating a placeholder:
# Get the top 10 neighbours for each data.germany.neighbours <- matrix(NA, nrow=ncol(data.germany.ibs.similarity),ncol=11,dimnames=list(colnames(data.germany.ibs.similarity))) |
Our empty placeholder should look like this:
[,1] [,2] [,3] [,4] [,5] [,6] [,7] [,8] [,9] [,10] [,11] a.perfect.circle NA NA NA NA NA NA NA NA NA NA NA abba NA NA NA NA NA NA NA NA NA NA NA ac.dc NA NA NA NA NA NA NA NA NA NA NA adam.green NA NA NA NA NA NA NA NA NA NA NA aerosmith NA NA NA NA NA NA NA NA NA NA NA afi NA NA NA NA NA NA NA NA NA NA NA |
Then we need to find the neighbours. This is another loop but runs much faster.
for(i in 1:ncol(data.germany.ibs)) { data.germany.neighbours[i,] <- (t(head(n=11,rownames(data.germany.ibs.similarity[order(data.germany.ibs.similarity[,i],decreasing=TRUE),][i])))) } |
It’s a little bit more complicated so lets break it down into steps:
- We loop through all our artists
- We sort our similarity matrix for the artist so that we have the most similar first.
- We take the top 11 (first will always be the same artist) and put them into our placeholder
- Note we use t() to rotate the similarity matrix since the neighbour one is shaped differently
The filled in placeholder should look like this:
[,1] [,2] [,3] a.perfect.circle "a.perfect.circle" "tool" "dredg" abba "abba" "madonna" "robbie.williams" ac.dc "ac.dc" "red.hot.chilli.peppers" "metallica" adam.green "adam.green" "the.libertines" "the.strokes" aerosmith "aerosmith" "u2" "led.zeppelin" afi "afi" "funeral.for.a.friend" "rise.against" |
This means for those listening to Abba we would recommend Madonna and Robbie Williams.
Likewise for people listening to ACDC we would recommend the Red Hot Chilli Peppers and Metallica.
User Based Recommendations
We will need our similarity matrix for User Based recommendations.
The process behind creating a score matrix for the User Based recommendations is pretty straight forward:
- Choose an item and check if a user consumed that item
- Get the similarities of that item’s top X neighbours
- Get the consumption record of the user of the top X neighbours
- Calculate the score with a formula: sumproduct(purchaseHistory, similarities)/sum(similarities)
We can start by creating a helper function to calculate the score mentioned in the last step.
# Lets make a helper function to calculate the scores getScore <- function(history, similarities) { x <- sum(history*similarities)/sum(similarities) x } |
We will also need a holder matrix. We will use the original data set now (data.germany):
# A placeholder matrix holder <- matrix(NA, nrow=nrow(data.germany),ncol=ncol(data.germany)-1,dimnames=list((data.germany$user),colnames(data.germany[-1]))) |
The rest is one big ugly nested loop. First the loop, then we will break it down step by step:
# Loop through the users (rows) for(i in 1:nrow(holder)) { # Loops through the products (columns) for(j in 1:ncol(holder)) { # Get the user's name and th product's name # We do this not to conform with vectors sorted differently user <- rownames(holder)[i] product <- colnames(holder)[j] # We do not want to recommend products you have already consumed # If you have already consumed it, we store an empty string if(as.integer(data.germany[data.germany$user==user,product]) == 1) { holder[i,j]<-"" } else { # We first have to get a product's top 10 neighbours sorted by similarity topN<-((head(n=11,(data.germany.ibs.similarity[order(data.germany.ibs.similarity[,product],decreasing=TRUE),][product])))) topN.names <- as.character(rownames(topN)) topN.similarities <- as.numeric(topN[,1]) # Drop the first one because it will always be the same song topN.similarities<-topN.similarities[-1] topN.names<-topN.names[-1] # We then get the user's purchase history for those 10 items topN.purchases<- data.germany[,c("user",topN.names)] topN.userPurchases<-topN.purchases[topN.purchases$user==user,] topN.userPurchases <- as.numeric(topN.userPurchases[!(names(topN.userPurchases) %in% c("user"))]) # We then calculate the score for that product and that user holder[i,j]<-getScore(similarities=topN.similarities,history=topN.userPurchases) } # close else statement } # end product for loop } # end user for loop data.germany.user.scores <- holder |
The loop starts by taking each user (row) and then jumps into another loop that takes each column (artists).
We then store the user’s name and artist name in variables to use them easily later.
We then use an if statement to filter out artists that a user has already listened to – this is a business case decision.
The next bit gets the item based similarity scores for the artist under consideration.
# We first have to get a product's top 10 neighbours sorted by similarity topN<-((head(n=11,(data.germany.ibs.similarity[order(data.germany.ibs.similarity[,product],decreasing=TRUE),][product])))) topN.names <- as.character(rownames(topN)) topN.similarities <- as.numeric(topN[,1]) # Drop the first one because it will always be the same song topN.similarities<-topN.similarities[-1] topN.names<-topN.names[-1] |
It is important to note the number of artists you pick matters. We pick the top 10.
We store the similarities score and song names.
We also drop the first column because, as we saw, it always represents the same song.
We’re almost there. We just need the user’s purchase history for the top 10 songs.
# We then get the user's purchase history for those 10 items topN.purchases<- data.germany[,c("user",topN.names)] topN.userPurchases<-topN.purchases[topN.purchases$user==user,] topN.userPurchases <- as.numeric(topN.userPurchases[!(names(topN.userPurchases) %in% c("user"))]) |
We use the original data set to get the purchases of our users’ top 10 purchases.
We filter out our current user in the loop and then filter out purchases that match the user.
We are now ready to calculate the score and store it in our holder matrix:
# We then calculate the score for that product and that user holder[i,j]<-getScore(similarities=topN.similarities,history=topN.userPurchases) |
Once we are done we can store the results in a data frame.
The results should look something like this:
X a.perfect.circle abba ac.dc 1 0.0000000 0.00000000 0.20440540 33 0.0823426 0.00000000 0.09591153 42 0.0000000 0.08976655 0.00000000 51 0.0823426 0.08356811 0.00000000 62 0.0000000 0.00000000 0.11430459 75 0.0000000 0.00000000 0.00000000 |
This basically reads that for user 51 we would recommend abba first, then a perfect circle, and we would not recommend ACDC.
This is not very pretty … so lets make it pretty:
We will create another holder matrix and for each user score we will sort the scores and store the artist names in rank order.
# Lets make our recommendations pretty data.germany.user.scores.holder <- matrix(NA, nrow=nrow(data.germany.user.scores),ncol=100,dimnames=list(rownames(data.germany.user.scores))) for(i in 1:nrow(data.germany.user.scores)) { data.germany.user.scores.holder[i,] <- names(head(n=100,(data.germany.user.scores[,order(data.germany.user.scores[i,],decreasing=TRUE)])[i,])) } |
The output of this will look like this:
X V1 V2 V3 1 flogging.molly coldplay aerosmith 33 peter.fox gentleman red.hot.chili.peppers 42 oomph. lacuna.coil rammstein 51 the.subways the.kooks the.hives 62 mando.diao the.fratellis jack.johnson 75 hoobastank papa.roach the.prodigy |
By sorting we see that actually the top 3 for user 51 is the subways, the kooks, and the hives!
References
- Data Mining and Business Analytics with R
- This case is based on Professor Miguel Canela “Designing a music recommendation app”
Entire Code
# Admin stuff here, nothing special options(digits=4) data <- read.csv(file="lastfm-data.csv") data.germany <- read.csv(file="lastfm-matrix-germany.csv") ############################ # Item Based Similarity # ############################ # Drop the user column and make a new data frame data.germany.ibs <- (data.germany[,!(names(data.germany) %in% c("user"))]) # Create a helper function to calculate the cosine between two vectors getCosine <- function(x,y) { this.cosine <- sum(x*y) / (sqrt(sum(x*x)) * sqrt(sum(y*y))) return(this.cosine) } # Create a placeholder dataframe listing item vs. item holder <- matrix(NA, nrow=ncol(data.germany.ibs),ncol=ncol(data.germany.ibs),dimnames=list(colnames(data.germany.ibs),colnames(data.germany.ibs))) data.germany.ibs.similarity <- as.data.frame(holder) # Lets fill in those empty spaces with cosine similarities for(i in 1:ncol(data.germany.ibs)) { for(j in 1:ncol(data.germany.ibs)) { data.germany.ibs.similarity[i,j]= getCosine(data.germany.ibs[i],data.germany.ibs[j]) } } # Output similarity results to a file write.csv(data.germany.ibs.similarity,file="final-germany-similarity.csv") # Get the top 10 neighbours for each data.germany.neighbours <- matrix(NA, nrow=ncol(data.germany.ibs.similarity),ncol=11,dimnames=list(colnames(data.germany.ibs.similarity))) for(i in 1:ncol(data.germany.ibs)) { data.germany.neighbours[i,] <- (t(head(n=11,rownames(data.germany.ibs.similarity[order(data.germany.ibs.similarity[,i],decreasing=TRUE),][i])))) } # Output neighbour results to a file write.csv(file="final-germany-item-neighbours.csv",x=data.germany.neighbours[,-1]) ############################ # User Scores Matrix # ############################ # Process: # Choose a product, see if the user purchased a product # Get the similarities of that product's top 10 neighbours # Get the purchase record of that user of the top 10 neighbours # Do the formula: sumproduct(purchaseHistory, similarities)/sum(similarities) # Lets make a helper function to calculate the scores getScore <- function(history, similarities) { x <- sum(history*similarities)/sum(similarities) x } # A placeholder matrix holder <- matrix(NA, nrow=nrow(data.germany),ncol=ncol(data.germany)-1,dimnames=list((data.germany$user),colnames(data.germany[-1]))) # Loop through the users (rows) for(i in 1:nrow(holder)) { # Loops through the products (columns) for(j in 1:ncol(holder)) { # Get the user's name and th product's name # We do this not to conform with vectors sorted differently user <- rownames(holder)[i] product <- colnames(holder)[j] # We do not want to recommend products you have already consumed # If you have already consumed it, we store an empty string if(as.integer(data.germany[data.germany$user==user,product]) == 1) { holder[i,j]<-"" } else { # We first have to get a product's top 10 neighbours sorted by similarity topN<-((head(n=11,(data.germany.ibs.similarity[order(data.germany.ibs.similarity[,product],decreasing=TRUE),][product])))) topN.names <- as.character(rownames(topN)) topN.similarities <- as.numeric(topN[,1]) # Drop the first one because it will always be the same song topN.similarities<-topN.similarities[-1] topN.names<-topN.names[-1] # We then get the user's purchase history for those 10 items topN.purchases<- data.germany[,c("user",topN.names)] topN.userPurchases<-topN.purchases[topN.purchases$user==user,] topN.userPurchases <- as.numeric(topN.userPurchases[!(names(topN.userPurchases) %in% c("user"))]) # We then calculate the score for that product and that user holder[i,j]<-getScore(similarities=topN.similarities,history=topN.userPurchases) } # close else statement } # end product for loop } # end user for loop # Output the results to a file data.germany.user.scores <- holder write.csv(file="final-user-scores.csv",data.germany.user.scores) # Lets make our recommendations pretty data.germany.user.scores.holder <- matrix(NA, nrow=nrow(data.germany.user.scores),ncol=100,dimnames=list(rownames(data.germany.user.scores))) for(i in 1:nrow(data.germany.user.scores)) { data.germany.user.scores.holder[i,] <- names(head(n=100,(data.germany.user.scores[,order(data.germany.user.scores[i,],decreasing=TRUE)])[i,])) } # Write output to file write.csv(file="final-user-recommendations.csv",data.germany.user.scores.holder) |

![]() Category: Code
Category: Code
![]() Tags: filtering, R, recommender
Tags: filtering, R, recommender


Hi Salem,
Thanks for clear explanation. I have few queries regarding similarity measures. Example that you considered here is implicit feed back information so it only contains 0’s and 1’s (1 – user purchased a product; 0 – user didn’t purchased a product. My doubt is when we have categorical data is cosine (or) Pearson’s correlation coefficient similarity
makes any sense?
Hi Naveen,
Actually it really depends on your data … but the cosine similarity is used for similarity among non-binary vectors too.
You can opt to use the same method described in this post with another similarity function (here are a few: http://mines.humanoriented.com/classes/2010/fall/csci568/portfolio_exports/lguo/similarity.html) one of which could be Pearsons’s coeff.
I hope this helps!
Salem, thank you so much for your detailed explanation of collaborative filtering.
Here, you have dealt with data which is binary (0s and 1s). However, what if the recommendations are to be made on the basis of data which gives the number of times an user listened to a particular artist? Not only 0s and 1s but 0 to any range. It will range up to the number of times that particular user listened to that artist. Maybe this scenario does not make much sense in a music recommendation app, but lets say we have purchase or sales data? One user might have a very high affinity to a certain product or certain groups of product. Does the reco engine change in that case?
I have tried running your code with the provided data set. Do you have any tips, advice or comments on how to make it run faster? Lets say in cases where there are over 10,000 users! In that scenario does the process of K-Means clustering come into place? If so, could you briefly describe how to go about such a case?
Thanks.
Hi Ark,
There is no reason why you cannot create a matrix of the number of times a user listened to an artist and create a similarity matrix from that – the scores will adjust based on the similarities. It is extremely slow because of the for loop that I use in the code. For loops are the arch enemy of R 🙁 if you have a large dataset I would recommend you port the (part) of the code to python which runs much faster. There is probably a smarter way to do the for loop bits.
Let us know if you find a way 🙂
Cheers,
Salem
Hi Salem ,
I’m trying to implement this with a large data set in R. (4m customers)
Any suggestions on how can I do this successfully?
Thanks in advance
Dunk
Hey Dunk,
To be honest I do not know how to improve the performance of the for loops in this code with R.
I would recommend using more processing power either on your machine (what OS are you using, I can give you hints on how to dedicate more memory to R) or send it to the cloud (Amazon has this service).
I also recommend you try porting the data processing bit to Python which is a lot friendlier with loops of this sort (I might just make a port of this snippet since it seems to be getting popular).
I know this is not much help but I hope it puts you on the right track at least.
Let us know how you solve it.
Cheers,
Salem
+1 for a python port! 😀
Late, but better than never? http://www.salemmarafi.com/code/collaborative-filtering-with-python/
Hi,
There is small correction in the following piece of code,
# Fill in placeholder with cosine similarities
data.germany.ibs.similarity[i,j] <- getCosine(as.matrix(data.germany.ibs[i]),as.matrix(data.germany.ibs[j]))
I think it should be like this,
data.germany.ibs.similarity[i,j] <- getCosine(as.matrix(data.germany.ibs[,i]),as.matrix(data.germany.ibs[,j]))
Thank you for the code.
Is it this true?, because Salem didn’t say anything about.
Kind regards.
Thanks for the code! But “big ugly nested loop” give me the
error: argument is of length zero and
In addition: Warning message:
In is.na(e2) : is.na() applied to non-(list or vector) of type ‘NULL’
Can you help with that, please?
Thanks in advance!
Lana
Hi Lana,
Are you using a different data set? If you are please share it so I can try and see where things are going wrong. That message usually means there are null values causing a problem somewhere.
Salem
Interesting to see this as R has so few examples for collaborative filtering. I’m running a recommender that produces recommendations for nearly 100K users against a similarity matrix with nearly 1M.
You need to avoid for statements entirely and rely on apply functions preferably with parallelization down to reduce processing times. I’ve got ours runs down to 1-2 hours daily.
Thanks! Can you suggest an edit?
Hi ,
Thanks for the code! but any help please you tell us the script of creating the frequency matrix because it is the first step!
Thanks in advance!
Hi Cristine,
This depends on your data set and how it is formatted. The purpose of the post is to demonstrate collaborative filtering in R. If you would like consulting or work done for you on data munging please feel free to email me and I can offer you those facilities at a standard daily rate.
Thanks,
Salem
Hi,
I have not your email.
Hi Cristine,
Say your data set looks like
User Item Score
1 Item 1 5
1 Item 3 4
2 Item2 3
2 Item3 4
You can create a sparse matrix or a matrix filled with 0’s( depends on the use case)
my_matrix <- acast(data, User~Item, value.var="Score", fill = 0)
(if you remove fill = 0 , the fillers will be NA)
Hope this helps
Hello,
Is it possible for you to share the code? I am also dealing with huge data, so it will be helpful for me.
Thanks in advance,
DM
can you please give the script of creating the frequency matrix
Hi,
I am using User based collaborative filtering.
Can you please suggest how can I include demographic similarity between users while creating recommendations in addition to what is already being considered.
Thanks
Yes sure 🙂 read this article it talks about both approaches:
http://www.ica.stc.sh.cn/picture/article/176/e8/55/189012ce47539f90ed6c0fa8a545/e4a07d49-5f1b-435f-b2db-e150598e8b83.pdf
Hi,
I have gone through the white paper but still not able to figure out how to merge this probability with user demographics similarity.
Please help.
Thanks
Vasundhara
hello Mr.sallam;
Thank you very much for your R script.
I have some error in my code
can you tell me yours email.
Thanks in advance
hello Mr.sallam;
THANK YOU very much for your R script.
I have some error in my code
can you tell me your email.
Thanks in advance
Hi Salem ,
thanks for this post!
For the part “User Based Recommendations” I run your code but R still turns (more than 2 hours) ,I am still awaiting the execution result of R ; this is normal ?I am still awaiting the execution result R, there is a mistake in your code ?
Can you tell me how much time did the code run 🙂
I know this is old, but you can always imbed one or two print statements in a (non-parallel) for statement to see its progress. I ran this on 1500 products and 13,000 users. It took a couple of days but I could see the progress from the RStudio command line.
Hi Salem
I not good at writing function, the one big ugly nested loop, will you able to write a function for this. I want to test the code’s performance under the package SNOW for a data of 30000 observations into 200 variables.
Thanks
Mittal
Hi Mittal 🙂 here is a python version: http://www.salemmarafi.com/code/collaborative-filtering-with-python/
Thanks, your python script solved my issue
Pingback: Collaborative Filtering with Python : Salem Marafi
This is cool… Do we have similar R code for temporal collaborative filtering technique?? please help
Hi,
Many thanks for your perfect explanations.
Happy to help Arghavan, thanks!
data.germany.user.scores.holder <- matrix(NA, nrow=nrow(data.germany.user.scores),ncol=100,dimnames=list(rownames(data.germany.user.scores)))
can you pls specify the significance of ncol=100 in the above code???
Hi Doyel,
ncol = 100 sets the number of columns to consider equal to 100
I hope this helps.
Salem
If I’m dealing with a sparse matrix, might I want to substitute “if(as.integer(data.germany[data.germany$user==user,product]) == 1)” for something more like if(!is.na(data.germany[data.germany$User==user,product]))? As it stands, I’m getting an error (missing value where TRUE/FALSE needed).
Thanks.
With respect to my prior post, if my assertion is correct, shouldn’t the next line be: holder[i,j]<- data.germany[data.germany$User==user,product]?
Hi Salem,
Thank you very much for the script! It has been really useful. As Lana, I got an error when running the loop in this line: if(as.integer(data[data$user==user,product]) == 1)
The error is: “Error in if (as.integer(data[data$user == user, product]) == 1) { :
argument is of length zero”. I am using another dataset, with binary data…maybe is because over the 80% is zero?
Thank you very much in advance!
@John Marx , you can contact me at maxwellalex222@yahoo.com
Hi Salem,
Thank you for wonderful explanation.
I have a question on user-based filtering. Pictorial depiction on top of your article shows that we are recommending grapes and orange to 3rd boy because this boy is similar to 1st girl because of 2 common fruits among them water-melon and strawberry.
However, in your code and explanation for user-based filtering you are no doing any user-to- user similarity calculation and only using cosine similarities calculated for item based filtering. Please help me in understanding this.
I have read another article which is based on rating scores and it calculates cosine similarities for user while applying user-based filtering.
http://www.dataperspective.info/2014/05/basic-recommendation-engine-using-r.html
Please help me in understanding the difference between two examples.
Regards,
Bharat
Pingback: Tổng hợp tutorials Collaborative filtering (Python, Java, R) | Ông Xuân Hồng
I understand we are using item to item similarity.
I am trying to understand if we are really using user to user similarity or
Is it a User based recommendation based on his purchase history?
Kindly help.
Hi Salem,
Thank you for your post. This was really helpful. My question is based on this current methodology, how do you evaluate the recommendations? More specifically, how can one calculate the MAE/RMSE for the recommendations?
Hi Salem,
Many thanks for your explanation. Must appreciate.
Can I ask if this is similar to the recommenderlab package in R?
and how do you suggest to validate the results it gives..like its recommending in a order for each user what he should most likely want. There should be a way for validation.In my case I am using super market data and recommend products to customers.
Any input would be helpful.
Thanks,
Prashanth
Thanks for clear explanation.
hi salem,
i have used ur code in my R Studio.how long it will take?
Hi, how can I evaluate the accuracy of recommendation using MAP(Mean Average Precision)in this dataset ?
If I divide the dataset into test data and training data, I don’t know how to rank the test data.
Do you have any idea?
Thank you
Hi Salem,
very useful post, thanks so much.
I would like to ask you. If I want to insert this recommender into a web site:
– Where reside the data? I mean, how would be the big picture of the architecture?
– Where is the matrix store?
– Suppose I have data about the users in a relational database, how would it work?
– Do I have to run the code with the online user together with the stored data and then obtain the recommendations?
My questions are maybe too general, but any comment would be highly appreciated.
Kind Regards,
Paul
How do you calculate MAE or any performance statistic in this case?
Thanks for clear explanation. I work in a country wherein there are multiple religions, and there are few singers who sings for multiple religions. I can’t recommend a song on the basis of singer or song only ( chances to recommend a song of other religion can’t be ruled out). Please help me to add a religion column in same example.
Thanks,
Navindra
Pingback: tepigluvr
Hi, Thanks for the code, I saw the same Raj said. I think you missed the comma when you calculate the cosine in the loop. Am I missing sth? I’m curious now because you haven’t corrected. Maybe I’m wrong. Thanks again.
HI again, I also have a doubt regarding the following part of the code
topN.userPurchases <- as.numeric(topN.userPurchases[!(names(topN.userPurchases) %in% c("user"))])
I don't understand what you are trying to do there but anyway, the filter won't work that way. "user" was the name of the user and c("user") it's only the word "user".
Would you please explain what were you trying to do in that step?
Thanks!
> for(i in 1:ncol(data.germany.ibs))
+ {
+ data.germany.neighbours[i,] <- (t(head(n=11,rownames(data.germany.ibs.similarity[order(data.germany.ibs.similarity[,i],decreasing=TRUE),][i]))))
+ }
Error in t.default(head(n = 11, rownames(data.germany.ibs.similarity[order(data.germany.ibs.similarity[, :
argument is not a matrix
i facing error after running above code .Code line# Get the top 10 neighbours for each kidly guide me on this …!!!
Hey ….i got the solution for that ….
But My New Question is How you created Matrix ‘lastfm-matrix-germany.csv’
actually how should be the approach for data collection …for explanation take example song recommendation itself ..Can you explain the pre processing step before matrix formation..it will great help /..
Hi Nabi,
I am facing the same issue with the code. How did you get it to work?
Hi Salem.
Can you give explanation for this code
# Lets make a helper function to calculate the scores
getScore <- function(history, similarities)
{
x <- sum(history*similarities)/sum(similarities)
x
}
Thank you, well in advance.
Dear Mr.Marafi,
your code meticulously explains all details behind filtering. i was trying to do both item based & user based filtering. i have followed your process for item based process & it ran well. but facing a problem for user based case, as in my sparse data, i do not have the user column(as you have in your data set). i have set my sparse data as,
w_data<-subset(data_work,select=c(Product_ID,Order.ID))
w_data$Item.Name<- as.character(w_data$Item.Name)
sparse_data<-acast(w_data, Order.ID ~ Product_ID, length)
& the sparse_data has no user specific information. i use this same sparse_data for item based filtering, faced no problem. but how can i do user based filtering from this? more specifically, to create the holder entity you have used the code
[ holder <- matrix(NA, nrow=nrow(data.germany),ncol=ncol(data.germany)-1,dimnames=list((data.germany$user),colnames(data.germany[-1]))) ]
how can i create that?
please guide me to rectify my misunderstanding. thanks in advance 🙂
Hi Saleem,
Good Evening
Thank you so much for your detailed explanation of collaborative filtering.
how to deal with categorical data? i stickup here
can you share your views to my email id .
Hi Saleem,
Thanks a lot for this post. Algorithm and explanation is brilliant! In your method we are making recommendations for all the users. Would there be a way to provide a threshold so that users with only top scores would get recommendations. Would you have an idea about how these thresholds could be set?
For User based collaborative filtering, can you please you apply function, edit the code & publish?
It’s taking huge amount of time to run.
i want to recommend all product , including the user have already. please tell me changes in above code
But how is the similarity measured? It must be obvious, but i am not getting it from looking at the function. I know how it works for two sentences.
Thanks in advance
I am wondering if the first part you discuss does not fit more into Collaborative Filtering as per
http://bigdata-doctor.com/recommender-systems-101-practical-example-in-r/
Please advise.
I find it a little confusing now to say the least.
I found the explanations a little confusing when compared with implementation. However, I withdraw my comment earluer as I gave seen the light.
Pls correct spelling.
Anyway, I would add lack of content awareness for Recommender Systems.
i have 30 gb data. how to process this data in this algorithm. i am using sparkR, but my server do not giving any response during read.csv(), but i am also trying fread() to read this ,
IS the any way to handle the big data problem?
sparkR have any limit of data size to handel the big data ?
Some optimizations for item based collaborative filtering:
getCosine <- function(x, y)
{
this.cosine <- sum(x * y) / (sqrt(sum(x * x)) * sqrt(sum(y * y)))
return(this.cosine)
}
ibsLoop <- function()
{
loopResult <- matrix(NA, nrow = ncol(data.germany.ibs), ncol = ncol(data.germany.ibs), dimnames = list(colnames(data.germany.ibs), colnames(data.germany.ibs)))
for (i in 1:ncol(data.germany.ibs))
for (j in 1:ncol(data.germany.ibs))
loopResult[i, j] <- getCosine(as.matrix(data.germany.ibs[i]), as.matrix(data.germany.ibs[j]))
return(loopResult)
}
ibsLoopDurationInSeconds <- system.time(data.germany.ibs.similarity <- ibsLoop())[["elapsed"]] # about 20 seconds on my machine
# Optimization 1: Work with a logical matrix instead of a numeric one, because logical functions are faster.
data.germany.ibs.logical <- as.matrix(data.germany.ibs)
data.germany.ibs.logical <- data.germany.ibs.logical == 1
# Distance function getCosine ^ 2 for two logial vectors:
getCosineSquaredLogical <- function(x, y)
{
sumxy = sum(x & y)
# Optimization 2: It's not neccessary to use the (costly) sqrt function here.
return(sumxy * sumxy / (sum(x) * sum(y)))
}
ibsLoopLogical <- function(sourceMatrix, distanceFunction)
{
loopResult <- matrix(NA, nrow = ncol(sourceMatrix), ncol = ncol(sourceMatrix), dimnames = list(colnames(sourceMatrix), colnames(sourceMatrix)))
colCount <- ncol(sourceMatrix)
for (i in 1:colCount)
# Optimization 3: Calculate only the upper half of the simularity matrix for now.
for (j in min(i + 1, colCount):colCount)
loopResult[i, j] <- distanceFunction(as.matrix(sourceMatrix[, i]), as.matrix(sourceMatrix[, j]))
# The distance of a vector to itself is always 1, no need to calculate that.
diag(loopResult) = 1
# Because the distance function is symmetric we can set the values in the lower half of the matrix according to the already calculated values of the upper half.
loopResult[is.na(loopResult)] = t(loopResult)[is.na(loopResult)]
return(loopResult)
}
ibsLoopOptimizedDurationInSeconds <- system.time(data.germany.ibs.similarity <- ibsLoopLogical(data.germany.ibs.logical, getCosineSquaredLogical))[["elapsed"]] # about 6 seconds on my machine
Hi Salem,
Thanks for the code.
However, I’m getting this error in the huge ugly for loop. Could you help me solve it?
Error in `[.data.frame`(buyfreq.ibs.similarity, , product) :
undefined columns selected
7.
stop(“undefined columns selected”)
6.
`[.data.frame`(buyfreq.ibs.similarity, , product)
5.
buyfreq.ibs.similarity[, product]
4.
order(buyfreq.ibs.similarity[, product], decreasing = TRUE)
3.
`[.data.frame`(buyfreq.ibs.similarity, order(buyfreq.ibs.similarity[,
product], decreasing = TRUE), )
2.
buyfreq.ibs.similarity[order(buyfreq.ibs.similarity[, product],
decreasing = TRUE), ]
1.
head(n = 11, (buyfreq.ibs.similarity[order(buyfreq.ibs.similarity[,
product], decreasing = TRUE), ][product]))
In addition: Warning message:
In if (as.integer(buyfreq[buyfreq$CustomerID == user, product]) == :
the condition has length > 1 and only the first element will be used
Hi Salem,
Can you please tell me when to use market basket analysis and collaborative filtering?small example will be a great help.
I’m using a different database and after performing the similarity analysis, I have to recommend the results (I’m recommending places) to the user in an android app. Can anyone help me? How should I go about it? How can I link Rstudio results to an android app? I need help urgently.Please
Thanks in advance.
Hi there, do you know of any R packages that do exactly that under the hood? I suppose there are a few to choose from https://gist.github.com/talegari/77c90db326b4848368287e53b1a18e8d
thanks!
Cool tutorial, thank you! Though it may be useful to offer an alternative solution to the nested for-loop. As we all know, R is quite slow in loops and way fasted when using vectorized apply-type functions. Therefore, instead of using a second loop, one can use an “apply” function instead, which speeds up the process tremendously.
for (i in 1:ncol(data.germany.ibs)){
data.germany.ibs.similarity[,i] = apply(radio_data, 2, getCosine, y=as.matrix(data.germany.ibs)[,i])
}
Awesome! Thanks 🙂
Hi Salem,
I guess you were talking about this solution. Well its a good idea but I am already using coSparse function to get cosine similarity for sparse matrix and its quite fast as well. However I am stuck in this sorting step –
topN<- (head(n=11,(data.similarity[order(data.similarity[,product],decreasing=TRUE),][product])))
Is it possible to vectorize this operation as well? Thanks a lot for your help!