Kuwait Sugar Consumption with R
I was doing Facebook’s Udacity Explorartory Data Analysis course and one of the tasks is to use GapMinder.org’s data to visualise data.
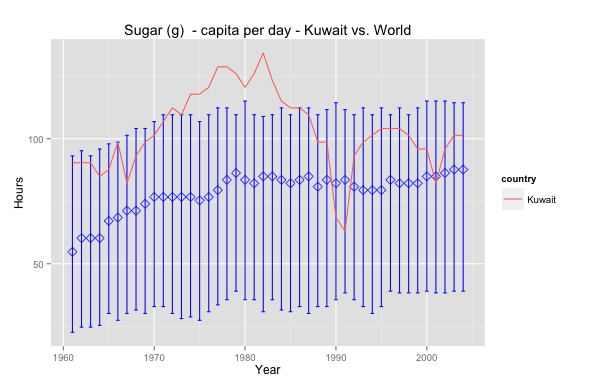
So I picked sugar consumption per capita per day; diabetes is a subject that has always been close and interesting to me. The graph above shows Kuwait’s sugar consumption relative to world averages.
Interesting that Kuwait has always been above the median and peaked in the 80’s – maybe that’s why obesity is such a prevalent issue nowadays. In 1990 the drop is, perhaps, due to a lack of data or perhaps due to an exodus of people. Nevertheless it seems that Kuwait has a long way to go in health awareness insofar as sugar consumption is concerned. Sugar consumption is lower today but still above the world median.
Want to reproduce this? Here’s the code – make sure to download the data set first! – :
# Data Cleansing data<-read.csv(file="gapminder.csv",na.strings="NA",row.names=1, header=T, blank.lines.skip=T) data<-(data.frame(t(data))) data<-data.frame(year=c(1961:2004), data) View(data) # Data Pivot library(reshape) data.melt<-melt(data,id='year',variable_name="country") data.melt<-subset(data.melt, value!='NA') data.melt.kuwait<-subset(data.melt, country=='Kuwait') data.melt.other<-subset(data.melt, country!='Kuwait') # Grouping data library('dplyr') year_group <- group_by(data.melt.other, year) wmsub.year_group <- summarise(year_group, mean=mean(value), median=median(value), lowerbound=quantile(value, probs=.25), upperbound=quantile(value, probs=.75)) # Plotting ggplot(data = wmsub.year_group, aes(x = year, y=median))+ geom_errorbar(aes(ymin = lowerbound, ymax = upperbound),colour = 'blue', width = 0.4) + stat_summary(fun.y=median, geom='point', shape=5, size=3, color='blue')+ geom_line(data=data.melt.kuwait, aes(year, value, color=country))+ ggtitle('Sugar (g) - capita per day - Kuwait vs. World')+ xlab('Year') + ylab('Hours') |


Pingback: Overweight in Kuwait – Food Supply with R : Salem Marafi