Kuwait Stock Exchange P/E with R
![]() Posted by Salem on April 7, 2014
Posted by Salem on April 7, 2014
Foreword
I was inspired by Meet Saptarsi’s post on R-Bloggers.com and decided to emulate the process for the Kuwait Stock Exchange.
Disclaimer This is not financial advice of any sort! I did this to demonstrate how R can be used to scrape information about the Kuwait Stock Exchange listed companies and do basic data analysis on the data.
Dig in!
First we want to set up the libraries we will use in our script.
We will be using XML to scrape websites and GGPlot2 to create our graphs.
library(XML) library('ggplot2') |
Kuwait Stock Exchange – Ticker Symbols
Initially I thought we could get all the information we want from the Kuwait stock exchange (KSE) website. I was terribly mistaken. KSE.com.kw is so behind the times … but atleast we can accurately gather the ticker names of companies listed in the KSE.
The process is simple.
- Find the page with information you want: http://www.kuwaitse.com/Stock/Companies.aspx
- Use readHTMLTable() to read the page, and find a table. In this case it’s table #35
- Now you have a data frame that you can access the tickers!
# Read Stock Information from KSE kse.url <- "http://www.kuwaitse.com/Stock/Companies.aspx" tables <- readHTMLTable(kse.url,head=T,which=35) tickers<-tables$Ticker |
P/E Ratios
P/E ratios are used to guage growth expectations of a company compared to others within a sector. You can find details about the P/E ratio here, but we will suffice by saying that we want to know what the market looks like in terms of P/E ratios.
Ideally the P/E ratio would be available from KSE or atleast access to digital forms of each company's financial statements. I was unable to find such a thing so I turned to MarketWatch.com. We can use the ticker codes we collected to grab the data we need.
The process is different because MarketWatch does not have HTML tables. Instead the process is slightly more complicated.
- Create a holder data frame
- Loop through each ticker and point to the relevant page:
http://www.marketwatch.com/investing/Stock/TICKER-NAME?countrycode=KW
Replacing TICKER-NAME with the ticker name - We go through the HTML elements of the page until we find the P/E Ratio
- Once we have collected all the P/E ratios, we do some data cleaning and we’re done!
What’s interesting is that after the data cleansing we lose 40 odd companies because there is no data available on their P/E ratios. This could also mean that these companies are losing money … because companies with no earnings have no P/E ratio! Realistically this is not a large number to hunt for but we omit them for the sake of simplicity here.
# Create an empty frame first pe.data <- data.frame('Ticker'='','PE'='') pe.data <- pe.data[-1,] # Loop through the ticker symbols for(i in 1:length(tickers)) { this.ticker<-tickers[i] # Set up the URL to use this.url <- paste("http://www.marketwatch.com/investing/Stock/",tickers[i],"?countrycode=KW",sep="") # Get the page source this.doc <- htmlTreeParse(this.url, useInternalNodes = T) # We can look at the HTML parts that contain the PE ratio this.nodes<-getNodeSet(this.doc, "//div[@class='section']//p") # We look for the value of the PE ratio within the nodes this.pe<-suppressWarnings(as.numeric(sapply(this.nodes[4], xmlValue,'data'))) # Add a row to the P/E data frame and move onto the next ticker! symbol pe.data<-rbind(pe.data,data.frame('Ticker'=this.ticker,'PE'=this.pe)) } # Combine the P/E data frame with the KSE ticker data frame combined<-(cbind(tables,pe.data)) # Lets do some data cleaning removing the 'NAs' combined.clean<-(combined[!(combined$PE %in% NA),]) # We attach our data frame to use the names of columns as variables attach(combined.clean) |
Data Exploration
We draw a box plot and output summary statistics.
We see that we have a number of outliers and generally the majority of P/E ratios are centered around 20.94.
boxplot(PE,col='blue') summary(PE) |

## Min. 1st Qu. Median Mean 3rd Qu. Max. ## 1.93 9.55 13.00 20.90 20.80 240.00 |
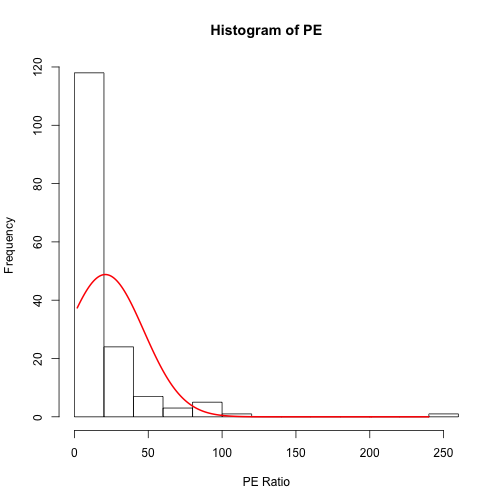
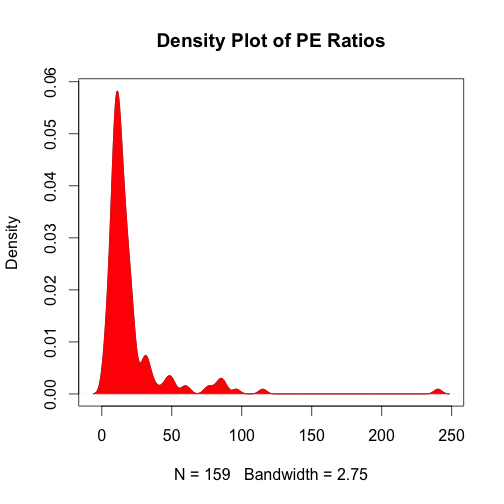
To see the spread we can look at a histogram or a density plot.
Both plots confirm a strong skew in the PE ratios.
# We can make a histogram histogram<-hist(PE,xlab="PE Ratio") # Draw a normal curve xfit<-seq(min(PE),max(PE)) yfit<-dnorm(xfit,mean=mean(PE),sd=sd(PE)) yfit <- yfit*diff(histogram$mids[1:2])*length(PE) lines(xfit, yfit, col="red", lwd=2) |
# Alternatively we can use a density plot plot(density(PE),main="Density Play of PE Ratios") polygon(density(PE), col="red", border="red",lwd=1) |
Scatter plot by industry
Lets get with it then.
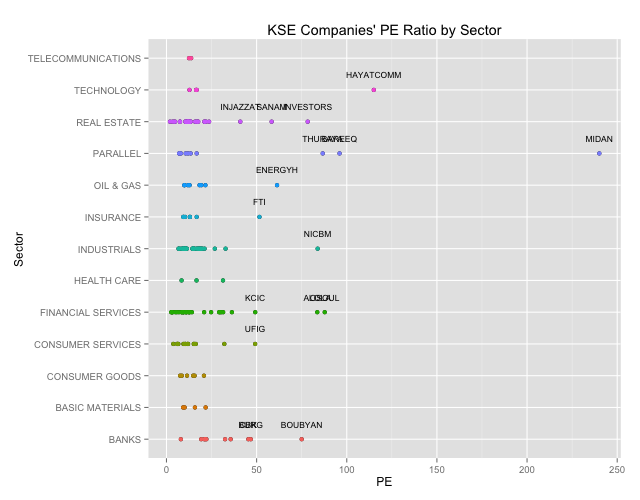
We want to see a plot of the P/E ratios by industry.
# We will want to highlihgt the outliers so lets get the outliers from our box plot outliers<-combined.clean[(which(PE %in% (boxplot.stats(PE)$out))),] # Lets create a Scatter Plot highlighting our outliers qplot(PE,Sector,main="KSE Companies' PE Ratio by Sector") + geom_point(aes(colour=Sector)) + geom_text(data=outliers,aes(label=outliers$Ticker),vjust=-2,cex=3)+ theme(legend.position = "none") |

We can clearly see the outliers. Generally outliers should tell you that something is fundamentally wrong. A company with a super high P/E ratio compared to its peers means that they have had terrible earnings, that investor expect some sort of extraordinary performance irrespective of the price, or that there is something fundamentally questionable about the numbers and you should dig in deeper. For details you can check out Investopedia.com
# Lets print out the outlier names (data.frame(outliers$Sector,outliers$Name)) |
## outliers.Sector outliers.Name ## 1 OIL & GAS THE ENERGY HOUSE CO ## 2 INDUSTRIALS NATIONAL INDUSTRIES COMPANY ## 3 CONSUMER SERVICES UNITED FOODSTUFF INDUSTRIES GROUP CO. ## 4 BANKS COMMERCIAL BANK OF KUWAIT ## 5 BANKS BURGAN BANK ## 6 BANKS BOUBYAN BANK ## 7 INSURANCE FIRST TAKAFUL INSURANCE COMPANY ## 8 REAL ESTATE INJAZZAT REAL ESTATE DEV. CO ## 9 REAL ESTATE INVESTORS HOLDING GROUP CO. ## 10 REAL ESTATE SANAM REAL ESTATE CO. ## 11 FINANCIAL SERVICES FIRST INVESTMENT COMPANY ## 12 FINANCIAL SERVICES OSOUL INVESTMENT CO. ## 13 FINANCIAL SERVICES KUWAIT CHINA INVESTMENT COMPANY ## 14 TECHNOLOGY HAYAT COMMUNICATIONS COMPANY ## 15 PARALLEL AL-BAREEQ HOLDING CO. ## 16 PARALLEL AL-MAIDAN CLINIC FOR ORAL HEALTH SERVICES CO. ## 17 PARALLEL DAR AL THURAYA REAL ESTATE CO. |


