Why we die – Mortality in Kuwait with R

I came across Randy Olson’s (editor at @DataIsBeautiful) tweet about causes of death in the US.
I thought I would replicate the information here using R and localize it for Kuwait – nothing fancy.
I will keep the code to the end because I think the results are quite interesting. The data source is from the UN Data portal
Here’s Randy Olson’s Tweet before we get going:
Less misleading remake of "How we #Die: Comparing the causes of death in 1900 vs. 2010." #health #dataviz pic.twitter.com/xw0AJ5tYRA
— Randy Olson (@randal_olson) June 9, 2014
Causes of Death in the General Population
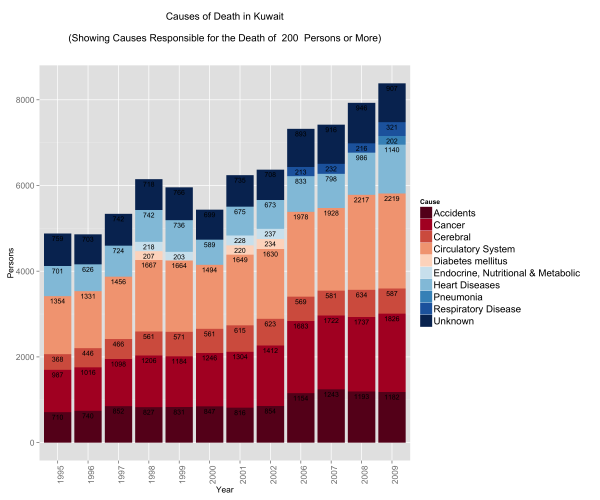
I always had the impression that the biggest issues with mortality in Kuwait were car accidents. Perhaps this is a bias introduced by media coverage. I always thought that if someone managed to survive their entire lives in Kuwait without dying in an accident, then only one other thing could get them ~ and that was cancer. This is not far from the truth:
What did catch me off guard is the number of people who die from circulatory system disease and heart disease. The numbers are not only large, but the trump both accidents and cancer figures. Interestingly enough, respiratory system diseases start to show up in 2006 just as problems with circulatory and pulmonary problems become more prevalent.
I thought that this surely is controlled within a demographic group.
So I decided to split the data into gender and age.
Causes of Death by Gender
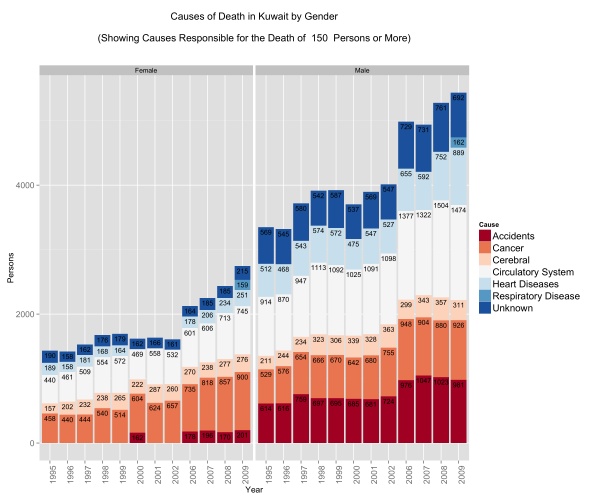
Looking at the gender differences the first eye-popping fact is that less women seem to be dying … this is misleading because the population is generally bias towards men. There are about 9 men for every 5 women in Kuwait.
The other eye-popping item that appears is in accidents. Less women pass away from accidents compared to men – a lot less! Is this indicative that women are safer drivers than their counterparts? Perhaps. In some nations this figure would indeed be zero because of social and legal constraints … it’s not necessarily good news … but it does stand out!
Proportionally there is a higher rate of mortality due to cancer in the female population vs. the male population.
Lastly, men seem to be more susceptible to death from heart diseases and circulatory system diseases. This might make you think why? Heart diseases and circulatory system diseases are exacerbated by sedentry life styles, poor diets, and other factors such as the consumption of tobacco. We have already looked at obesity in Kuwait … perhaps a deeper dive might shed some light on this matter.
For now, lets move on … surely younger people do not suffer from heart diseases …
Causes of Death by Age Group
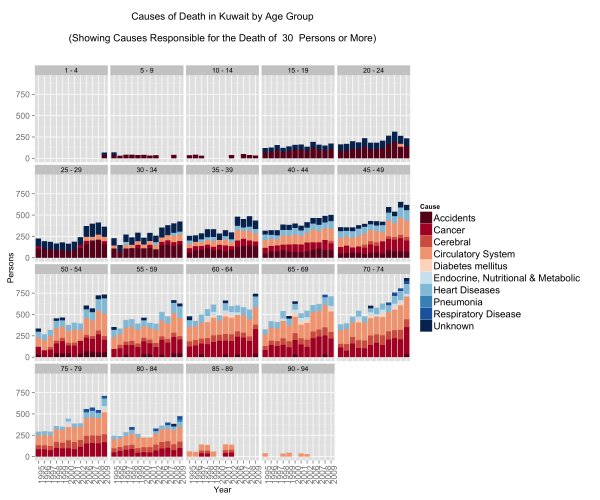
This one confirms that if an accident does not get you before you’re 25 then the rest of the diseases are coming your way.
People fall victim to circulatory, respiratory, and heart diseases at extremely young ages. In fact what we see here is that irrespective of age group, after the age of 40 the mortality rates are the same for these three diseases.
On the other hand, accident mortalities go down as people shift to older age groups but are displaced by cancer. What is terribly depressing about this graph are the number of people below the ages of 19 that die in accidents. These might be just numbers, but in reality these are very real names to families.
Take-aways
The graphs were just a fun way to play with R. What we can take away is that of the 5 main causes for mortality in Kuwait – Cancer, Heart Diseases, Circulatory Diseases, Respiratory Diseases, and Accidents – 4 of them are addressible through policy, regulation, and raising public awareness for social/behavioural impact.
Code
You can download the Kuwait dataset here or from the UN’s Data Portal.
Load up R and run the code below – fully commented for your geeky enjoyment:
# In Libraries we Trust library(ggplot2) library(dplyr) # Read Data data.mortality<-read.csv('kuwait.csv') ################## # Data Munging # ################## # Change Year into a categorical variable data.mortality$Year<-as.factor(data.mortality$Year) # Rename our columns names(data.mortality)<-c("Country","Year","Area","Sex","Age","Cause","Record","Reliability","Source.Year","Value","Value.Notes") # Data cleaning, here we groups some items together for simplification. # Eg. All forms of neoplasms are grouped under "Cancer". data.mortality$Cause<-gsub(pattern=", ICD10","",x=data.mortality$Cause) data.mortality[grep(pattern="eoplasm",x=data.mortality$Cause),]$Cause<-"Cancer" data.mortality[grep(pattern="ccidents",x=data.mortality$Cause),]$Cause<-"Accidents" data.mortality[grep(pattern="not elsewhere classified",x=data.mortality$Cause),]$Cause<-"Unknown" data.mortality[grep(pattern="External causes",x=data.mortality$Cause),]$Cause<-"Unknown" data.mortality[grep(pattern="Congenital malformations",x=data.mortality$Cause),]$Cause<-"Congenital malformations" data.mortality[grep(pattern="Certain conditions originating in the perinatal period",x=data.mortality$Cause),]$Cause<-"Perinatal period conditions" data.mortality[grep(pattern="Endocrine, nutritional and metabolic",x=data.mortality$Cause),]$Cause<-"Endocrine, Nutritional & Metabolic" data.mortality[grep(pattern="Diseases of the respiratory",x=data.mortality$Cause),]$Cause<-"Respiratory Disease" data.mortality[grep(pattern="Diseases of the circulatory system",x=data.mortality$Cause),]$Cause<-"Circulatory System" data.mortality[grep(pattern="Hypertensive diseases",x=data.mortality$Cause),]$Cause<-"Cerebral" data.mortality[grep(pattern="Ischaemic heart diseases",x=data.mortality$Cause),]$Cause<-"Heart Diseases" data.mortality[grep(pattern="Cerebrovascular diseases",x=data.mortality$Cause),]$Cause<-"Cerebral" ######################### # Data Transformations # ######################### # Use the dplyr library to group items from the original data set # We want a general understanding of causes of death # We subset out All causes to avoid duplication # We subset out age groups that cause duplication # We group by Country, Year and Cause # We create a summary variable "Persons" that is the sum of the incidents # We sort by Cause for pretty graphs kw.general <- data.mortality %.% subset(!(Cause %in% "All causes")) %.% subset(Country %in% "Kuwait") %.% subset(!(Age %in% c("Total","Unknown","85 +","95 +","1","2","3","4","0"))) %.% group_by(Country) %.% group_by(Year) %.% group_by(Cause) %.% summarise(Persons=sum(Value)) %.% arrange(Cause) # We want an understanding of causes of death by age group # We subset out All causes to avoid duplication # We subset out age groups that cause duplication # We group by Country, Year, Age and Cause # We create a summary variable "Persons" that is the sum of the incidents # We sort by Cause for pretty graphs kw.age<-data.mortality %.% subset(!(Cause %in% "All causes")) %.% subset(Country %in% "Kuwait") %.% subset(!(Age %in% c("Total","Unknown","85 +","95 +","1","2","3","4","0"))) %.% group_by(Country) %.% group_by(Year) %.% group_by(Age) %.% group_by(Cause) %.% summarise(Persons=sum(Value)) %.% arrange(Cause) # We reorder our age groups manually for pretty graphs kw.age$Age<-(factor(kw.age$Age,levels(kw.age$Age)[c(1,2,6,9,12,3,15,4,5,7,8,10,11,13,14,16:28)])) # We want an understanding of causes of death by gender # We subset out All causes to avoid duplication # We subset out age groups that cause duplication # We group by Country, Year, Gender and Cause # We create a summary variable "Persons" that is the sum of the incidents # We sort by Cause for pretty graphs kw.sex<-data.mortality %.% subset(!(Cause %in% "All causes")) %.% subset(Country %in% "Kuwait") %.% subset(!(Age %in% c("Total","Unknown","85 +","95 +","1","2","3","4","0"))) %.% group_by(Country) %.% group_by(Year) %.% group_by(Sex) %.% group_by(Cause) %.% summarise(Persons=sum(Value)) %.% arrange(Cause) ######################################## # Graphing, Plotting, Dunking Cookies # ######################################## # We will limit our graphs by number of persons each incidents cause # The main reason is because we do not want a graph that looks like a chocolate chip cookie PersonLimit <- 200 # Plot the General data General<-ggplot(subset(kw.general,Persons>=PersonLimit), aes(x = Year, y = Persons)) + geom_bar(aes(fill=Cause),stat='identity', position="stack")+ ggtitle(paste("Causes of Death in Kuwait\n\n(Showing Causes Responsible for the Death of ",PersonLimit," Persons or More)\n\n"))+ theme(axis.text.x = element_text(angle = 90, hjust = 1), legend.text=element_text(size=14), axis.text=element_text(size=12), axis.title=element_text(size=12))+ scale_fill_brewer( palette = "RdBu")+ geom_text(aes(label = Persons,y=Persons,ymax=Persons), size = 3.5, vjust = 1.5, position="stack",color=I("#000000")) # Reset the Person Limit PersonLimit <- 150 # Plot the Gender data faceted by Gender Gender<-ggplot(subset(kw.sex,Persons>=PersonLimit), aes(x = Year, y = Persons)) + geom_bar(aes(fill=Cause),stat='identity', position="stack")+ facet_wrap(~Sex)+ ggtitle(paste("Causes of Death in Kuwait by Gender\n\n(Showing Causes Responsible for the Death of ",PersonLimit," Persons or More)\n\n"))+ theme(axis.text.x = element_text(angle = 90, hjust = 1), legend.text=element_text(size=14), axis.text=element_text(size=12), axis.title=element_text(size=12) )+ scale_fill_brewer( palette = "RdBu" )+ geom_text(aes(label = Persons,y=Persons,ymax=Persons), size = 3.5, vjust = 1.5, position="stack",color=I("#000000")) # Reset the Person Limit PersonLimit <- 30 # Plot the Age group data facted by Age Age<-ggplot(subset(kw.age,Persons>=PersonLimit), aes(x = Year, y = Persons)) + geom_bar(aes(fill=Cause),stat='identity', position="stack")+ facet_wrap(~Age)+ ggtitle(paste("Causes of Death in Kuwait by Age Group\n\n(Showing Causes Responsible for the Death of ",PersonLimit," Persons or More)\n\n"))+ theme(axis.text.x = element_text(angle = 90, hjust = 1), legend.text=element_text(size=14), axis.text=element_text(size=12), axis.title=element_text(size=12) )+ scale_fill_brewer( palette = "RdBu" ) # Save all three plots ggsave(filename="General.png",plot=General,width=12,height=10) ggsave(filename="Age.png",plot=Age,width=12,height=10) ggsave(filename="Gender.png",plot=Gender,width=12,height=10) |


can we do machine learning on this data-set? if yes thn could you please give some idea.