Market Basket Analysis with R
![]() Posted by Salem on March 19, 2014
Posted by Salem on March 19, 2014
Association Rules
There are many ways to see the similarities between items. These are techniques that fall under the general umbrella of association. The outcome of this type of technique, in simple terms, is a set of rules that can be understood as “if this, then that”.
Applications
So what kind of items are we talking about?
There are many applications of association:
- Product recommendation – like Amazon’s “customers who bought that, also bought this”
- Music recommendations – like Last FM’s artist recommendations
- Medical diagnosis – like with diabetes really cool stuff
- Content optimisation – like in magazine websites or blogs
In this post we will focus on the retail application – it is simple, intuitive, and the dataset comes packaged with R making it repeatable.
The Groceries Dataset
Imagine 10000 receipts sitting on your table. Each receipt represents a transaction with items that were purchased. The receipt is a representation of stuff that went into a customer’s basket – and therefore ‘Market Basket Analysis’.
That is exactly what the Groceries Data Set contains: a collection of receipts with each line representing 1 receipt and the items purchased. Each line is called a transaction and each column in a row represents an item. You can download the Groceries data set to take a look at it, but this is not a necessary step.
A little bit of Math
We already discussed the concept of Items and Item Sets.
We can represent our items as an item set as follows:
Therefore a transaction is represented as follows:
This gives us our rules which are represented as follows:
Which can be read as “if a user buys an item in the item set on the left hand side, then the user will likely buy the item on the right hand side too”. A more human readable example is:
If a customer buys coffee and sugar, then they are also likely to buy milk.
With this we can understand three important ratios; the support, confidence and lift. We describe the significance of these in the following bullet points, but if you are interested in a formal mathematical definition you can find it on wikipedia.
- Support: The fraction of which our item set occurs in our dataset.
- Confidence: probability that a rule is correct for a new transaction with items on the left.
- Lift: The ratio by which by the confidence of a rule exceeds the expected confidence.
Note: if the lift is 1 it indicates that the items on the left and right are independent. - We set the minimum support to 0.001
- We set the minimum confidence of 0.8
- We then show the top 5 rules
- The number of rules generated: 410
- The distribution of rules by length: Most rules are 4 items long
- The summary of quality measures: interesting to see ranges of support, lift, and confidence.
- The information on the data mined: total data mined, and minimum parameters.
- What are customers likely to buy before buying whole milk
- What are customers likely to buy if they purchase whole milk?
- We set the confidence to 0.15 since we get no rules with 0.8
- We set a minimum length of 2 to avoid empty left hand side items
- Snowplow Market Basket Analysis
- Discovering Knowledge in Data: An Introduction to Data Mining
- RDatamining.com
Apriori Recommendation with R
So lets get started by loading up our libraries and data set.
# Load the libraries library(arules) library(arulesViz) library(datasets) # Load the data set data(Groceries) |
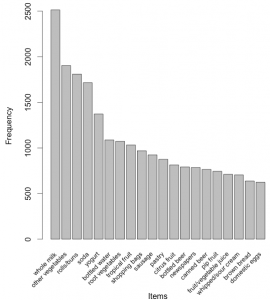
Lets explore the data before we make any rules:
# Create an item frequency plot for the top 20 items itemFrequencyPlot(Groceries,topN=20,type="absolute") |
We are now ready to mine some rules!
You will always have to pass the minimum required support and confidence.
# Get the rules rules <- apriori(Groceries, parameter = list(supp = 0.001, conf = 0.8)) # Show the top 5 rules, but only 2 digits options(digits=2) inspect(rules[1:5]) |
The output we see should look something like this
lhs rhs support confidence lift 1 {liquor,red/blush wine} => {bottled beer} 0.0019 0.90 11.2 2 {curd,cereals} => {whole milk} 0.0010 0.91 3.6 3 {yogurt,cereals} => {whole milk} 0.0017 0.81 3.2 4 {butter,jam} => {whole milk} 0.0010 0.83 3.3 5 {soups,bottled beer} => {whole milk} 0.0011 0.92 3.6 |
This reads easily, for example: if someone buys yogurt and cereals, they are 81% likely to buy whole milk too.
We can get summary info. about the rules that give us some interesting information such as:
set of 410 rules rule length distribution (lhs + rhs): sizes 3 4 5 6 29 229 140 12 summary of quality measures: support conf. lift Min. :0.00102 Min. :0.80 Min. : 3.1 1st Qu.:0.00102 1st Qu.:0.83 1st Qu.: 3.3 Median :0.00122 Median :0.85 Median : 3.6 Mean :0.00125 Mean :0.87 Mean : 4.0 3rd Qu.:0.00132 3rd Qu.:0.91 3rd Qu.: 4.3 Max. :0.00315 Max. :1.00 Max. :11.2 mining info: data n support confidence Groceries 9835 0.001 0.8 |
Sorting stuff out
The first issue we see here is that the rules are not sorted. Often we will want the most relevant rules first. Lets say we wanted to have the most likely rules. We can easily sort by confidence by executing the following code.
rules<-sort(rules, by="confidence", decreasing=TRUE) |
Now our top 5 output will be sorted by confidence and therefore the most relevant rules appear.
lhs rhs support conf. lift 1 {rice,sugar} => {whole milk} 0.0012 1 3.9 2 {canned fish,hygiene articles} => {whole milk} 0.0011 1 3.9 3 {root vegetables,butter,rice} => {whole milk} 0.0010 1 3.9 4 {root vegetables,whipped/sour cream,flour} => {whole milk} 0.0017 1 3.9 5 {butter,soft cheese,domestic eggs} => {whole milk} 0.0010 1 3.9 |
Rule 4 is perhaps excessively long. Lets say you wanted more concise rules. That is also easy to do by adding a “maxlen” parameter to your apriori function:
rules <- apriori(Groceries, parameter = list(supp = 0.001, conf = 0.8,maxlen=3)) |
Redundancies
Sometimes, rules will repeat. Redundancy indicates that one item might be a given. As an analyst you can elect to drop the item from the dataset. Alternatively, you can remove redundant rules generated.
We can eliminate these repeated rules using the follow snippet of code:
subset.matrix <- is.subset(rules, rules) subset.matrix[lower.tri(subset.matrix, diag=T)] <- NA redundant <- colSums(subset.matrix, na.rm=T) >= 1 rules.pruned <- rules[!redundant] rules<-rules.pruned |
Targeting Items
Now that we know how to generate rules, limit the output, lets say we wanted to target items to generate rules. There are two types of targets we might be interested in that are illustrated with an example of “whole milk”:
This essentially means we want to set either the Left Hand Side and Right Hand Side. This is not difficult to do with R!
Answering the first question we adjust our apriori() function as follows:
rules<-apriori(data=Groceries, parameter=list(supp=0.001,conf = 0.08), appearance = list(default="lhs",rhs="whole milk"), control = list(verbose=F)) rules<-sort(rules, decreasing=TRUE,by="confidence") inspect(rules[1:5]) |
The output will look like this:
lhs rhs supp. conf. lift 1 {rice,sugar} => {whole milk} 0.0012 1 3.9 2 {canned fish,hygiene articles} => {whole milk} 0.0011 1 3.9 3 {root vegetables,butter,rice} => {whole milk} 0.0010 1 3.9 4 {root vegetables,whipped/sour cream,flour} => {whole milk} 0.0017 1 3.9 5 {butter,soft cheese, domestic eggs} => {whole milk} 0.0010 1 3.9 |
Likewise, we can set the left hand side to be “whole milk” and find its antecedents.
Note the following:
rules<-apriori(data=Groceries, parameter=list(supp=0.001,conf = 0.15,minlen=2), appearance = list(default="rhs",lhs="whole milk"), control = list(verbose=F)) rules<-sort(rules, decreasing=TRUE,by="confidence") inspect(rules[1:5]) |
Now our output looks like this:
lhs rhs support confidence lift 1 {whole milk} => {other vegetables} 0.075 0.29 1.5 2 {whole milk} => {rolls/buns} 0.057 0.22 1.2 3 {whole milk} => {yogurt} 0.056 0.22 1.6 4 {whole milk} => {root vegetables} 0.049 0.19 1.8 5 {whole milk} => {tropical fruit} 0.042 0.17 1.6 6 {whole milk} => {soda} 0.040 0.16 0.9 |
Visualization
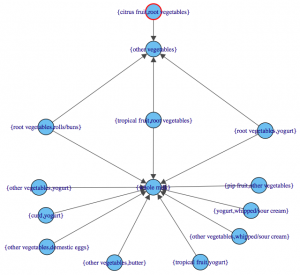
The last step is visualization. Lets say you wanted to map out the rules in a graph. We can do that with another library called “arulesViz”.
library(arulesViz) plot(rules,method="graph",interactive=TRUE,shading=NA) |
You will get a nice graph that you can move around to look like this:
References
Resources

![]() Category: Code
Category: Code
![]() Tags: apriori, arules, arulesViz, association, data, data mining, mining, R
Tags: apriori, arules, arulesViz, association, data, data mining, mining, R


Pingback: Collaborative Filtering with R : Salem Marafi
Pingback: Customer Segmentation: Excel and R : Salem Marafi
A Very good article on MBA. Thank you for posting.
Enjoyed the piece..your code worked to perfection…was attempting to get a grip on MBA the R route…Many Thanks
Hi Ashok!
Glad it worked! Let me know if I can help any more ^_^
Cheers for stopping to read the post!
Hi Salem,
Just in case you can increase the complexity tier of the dataset – say introduce a CustomerID and say Date of Purchase to begin with…something akin to raw data that we normally get…I am not sure if it would be worth your while…all the same… also it may not be a bad idea I feel to add some literature to your visualisation piece…as a final thought if your visualisation could resemble a la SPSS/equivalent – with some dashboards thrown in – the impact would be substantial.
Cheers!!
Pingback: Effective Cross Selling using Market Basket Analysis
Hi Saleem,
It was really nice explination about MBA using apriori algorithm.
I am trying build algorithm using different category(i.e sports).
Can you please help me to showcase my data as package, similar to your groceries data.
Thanks in advance.
Prashant
Hi Prashant,
Sure, the groceries dataset comes packaged with R.
If you want to make your data available to others you might want to look into saving your workspace with save() or saving your data set with save.image().
I am not sure if I answered the question you were after – let me know if I haven’t 🙂
Cheers,
Salem
Hi Saleem,
Thanks for your promt reply. Actualy my question was little different, am trying to create market basket analysis for sports category similar to your grocery category, since i have ctreated dummy transactional data for sports items, and using it as csv file but unfortunately am unable to get very neat out like your, hence i just wondering whether my data set creation have any problem.
If you want i can share my sample data with you. I will more than happy to talk to you over phone also.
Your help is greatly appreciated.
Thanks,
Prashant
Sure! I’ll send you an email now, please send across a sample data set.
Plz send me the Sports data, I want it for my semester project
k112191@nu.edu.pk
Hi Salem,
I am trying to read in my own data, but unfortunetly I get an error:
Error in (function (classes, fdef, mtable) :
unable to find an inherited method for function ‘itemFrequencyPlot’ for signature ‘”data.frame”’
Do you perhaps know why? Have I read in the data wrong?
Appreciate the effort.
Regards,
Omid
Hi Omid!
Did you try using read.transactions() to read in the data?
Hi Salem,
I also get the same error, but for the visualization attempt:
> # Create an item frequency plot for the top 20 items
> itemFrequencyPlot(ITVM,topN=20,type=”absolute”)
Error in (function (classes, fdef, mtable) :
unable to find an inherited method for function ‘itemFrequencyPlot’ for signature ‘”data.frame”’
Also, is there a way to append the code so that empty RHS rules are removed?
Thanks so much for a great blog!
Hi Salem Again,
Like i mentioned earlier, i am working on sports category data for MBA, for my lhs product (i.e. input product) am geting missings({ }) as rhs. am using “read.transactions” to read data where it ask for “rm.duplicate=T”. I expect due to removing duplicate data i might be facing this issue.
Do you know any other options read data where i done need to lose any data & get my product details in rhs?
Thanks Again,
Prashant
Hi Prashant!
Actually that is normal behaviour if you do not set the minimum number of required rules.
If you read the help file on the apriori library it is mentioned there.
If you get an empty LHS with an item on the RHS {}=>{Cookies} it means that no matter what item you choose, you will always get cookies.
Likewise if you get an empty RHS with an item on the LHS it means that if you select the item on the LHS it will be the only item in the basket.
If you are getting a lot of these empty brackets you have different options:
– Increase your data set it might be too sparse
– Change the confidence intervals (lift, support, confidence)
I hope this helps.
Can u please share your sports data with me…..I want it for my semester project
ID: k112191@nu.edu.pk
hi Salem
great article , my thesis is on market basket analysis , and what u wrote is perfect , but incase u have any data on any retail shop which implemented this with their numbers that would be just great. it could help me a lot and saves my time i should defend my thesis in two months and yet havent found a single data on any other shop apart ours:(
regards
F
Hi Angela,
A lot of retailers have this implemented. In the UK Tesco’s loyalty system started based on this algorithm. If you have 2 months I think to defend your thesis it would be even better if you partnered with a local retailer and ran a pilot. Thoughts?
Salem
hi angel
i have some real time basket data i could send you
contact me
Plz send me the data asap i want it for my semester project
k112191@mu.edu.pk
Hi Eric,
I’m writing my Bachelor thesis about Market Basket Analysis and looking everywhere for some data, I didn’t find anything so far, maybe you could send me yours, it would be really great!
Hi!! could you please share your real data with me?
Thank you so much!
Sabrina
Hi Saleem,
Really helpful article.
I am having trouble converting csv to transaction data.
The original groceries dataset has 9835 rows and 169 columns. But when I try to convert the groceries.csv to transaction using the read(df,”transactions”) it results into a transaction data with 9835 rows but 7011 columns.
Any help in this regard will be appreciated.
Hi Manu,
Try read.transactions instead of just read. It should work fine.
Cheers,
Salem
Thanks Saleem.
read.transactions worked for me.
I did use it before but did not set the format then.
Setting the format to basket did the trick.
Thanks once again
Hi Manu,
I am having somewhat similar problem. My CSV file contains 15000 rows and 33 columns but when I am trying to run apriori algorithm on it, R crashes. This file is just 5 mb. I don`t know what to do now?
Do you have any idea of an R package which uses the fp-growth for association rule mining.
Thanks
manu
Hi Manu,
Great question. An implementation is available here: http://en.wikibooks.org/wiki/Data_Mining_Algorithms_In_R/Frequent_Pattern_Mining/The_FP-Growth_Algorithm if you end up using this please share I would be interested to seeing differences.
Cheers,
Salem
Hello,
I have thefollowing comment when using the read.trans.
groceries<-read.transactions("groceries.csv",sep = ",")
Error in asMethod(object) :
can not coerce list with transactions with duplicated items
can you please advise
This walk through was incredibly helpful for me. I must thank you.
Once the analysis is complete, what is the best way to take the results from the console to a report in Excel or a PDF? Any tips there?
Thanks again!
Chris
Hi Chris!
Thanks :] glad you found it useful.
Yes you can write the rules to a CSV files like this:
You can also save the graph to an image file using jpeg()
Let us know if that works for you 🙂
I am unable to find itemFrequencyPlot(). I have the arules package installed. Pls let me know where I can find this func. Thanks.
Hi Bharadwaj,
It’s part of the package:
http://www.inside-r.org/packages/cran/arules/docs/itemFrequencyPlot
very nice blog.I am going to work on the same.Can you please tell me which dataset you have used ? I have searched a lot and haven’t got a proper dataset.
Hi Vishu,
I used the groceries dataset available in R.
Thanks!
Hi Salem,
I encountered this error when I tried plotting the visualization:
Error in i.parse.plot.params(graph, list(…)) :
object ‘v.color’ not found
Is there a package dependency I may have missed? Perhaps igraph?
I used:
library(arules)
library(arulesViz)
Hi Jeremy,
After some research it looks like that error is indeed generated by igraph.
Have you tried install.packages(“igraph”); library(igraph) ?
Salem
Hi,
After installing the igraph I am still encounter with the same error.. any ideas?….
This is what i am trying to run:
> library(igraph)
> library(arulesViz)
> plot(rules,method=”graph”,interactive=TRUE,shading=NA)
Error in i.parse.plot.params(graph, list(…)) :
object ‘v.color’ not found
Also, do you happened to know if there are other MBA algorithms which was implemented in R?…
Thanks.
Thank you Salem for this wonderful review. I also get the same error, even after installing/ loading igraph. I am running the latest version of R as well.
Please let me know if you have any other suggestions.
Hi, did you find a solution? I get the same error despite
– installing igraph,
– re-installing tcltk => capabilities(“tcltk”) result is TRUE
I use R 3.1.2 binary for Mac OS X 10.9 (Mavericks) and higher. Therefore I also re-installed XQuartz.
Thanks for any advice!
Cheers,Lucie
Within the apriori function, in parameter = list(…); provide target =
It can be one of “frequent itemsets”, “maximally frequent itemsets”, “closed frequent itemsets”, “rules”, “hyperedgesets”
Works for all but rules, which still gives the error. So I hazard a guess that it is internal (?).
Others give you nice graphs.
Hope this helps.
I was able to get the diagram by changing the shading to TRUE from the sample NA:
plot(rules,method=”graph”,interactive=TRUE,shading=TRUE)
I would like to use this example after doing some cleaning of my text (i.e. using tm_map to remove stop words etc
I have a corpus data structure – how do I convert this into the structure you are using?
i dont understand the concept of MBA is good but there is no link to the coding and the output
i want an example application for mad but according to your coding the output is displaying like v1 v2 v3 observations and N/A and FALSE there is no comparing and no items so please give me a valid example
Hello,
If I using data drawn from an excel sheet instead of the dataset does it require extra coding. I tried using the data without any change to the data and received an error message.
Thanks.
Actually, I may have solved it.
Setting the target=”hyperedgesets”
seems to create a graphable object. I am still very new to this so I’m not sure if there is a way to make the original work. The graphs produced this way show baskets that the genes belong to and not the genes connected to each other.
rules2 <- apriori(y, parameter = list(supp = 0.001, conf = 0.8, target="hyperedgesets"))
plot(rules2,method="graph", interactive=TRUE, shading=NA)
Hi Salem,
The article is too good got a clear picture of market basket analysis.Thank you. I am actually looking for real market basket datasets for one of my academic projects, so if you have any or if you know something about it please let me know. Thanks in advance.
Regards
Harish
Hi Salem,
Thanks for great article.
can you tell me how can I upload my own data(.csv file, similar to groceries file)
I have data in my desktop folder. how do I set path for that?
Also, I too got this error
Error in i.parse.plot.params(graph, list(…)) :
object ‘v.color’ not found
Thanks
This is me again
Finally, I able to load my file and able to run some rules
but the result came like this
inspect(rules[1:4])
lhs rhs support confidence lift
1 {} => { true} 0.99853 0.99853 1.0000
2 {} => { false} 0.99853 0.99853 1.0000
3 { true} => { false} 0.99780 0.99926 1.0007
4 { false} => { true} 0.99780 0.99926 1.0007
it is because my dataset in this format:
Basket ID Candy Lemons coffee milk
C11867 false false false false
C5096 false false false false
C4295 false false false false
can you give some hint, how would I change this data to transaction matrix
Thanks
Hi Salem..
This article is very useful.
If possible can we have an article on customer churning model.
Your help in this regard will be highly appreciated.
Thanks…
Real great stuff here. I was wondering if you knew of any transactions data sets like Groceries that also contained customer attributes (such as a customer ID linked to demographic variables) for each transaction? I’d like to extend this analysis to incorporate some of those factors, but I haven’t been able to find a suitable dataset.
Regards,
Kevin
Hi,
thanks for this article.
Just a question: do you have set the minimum support and confidence using some information from the plot or do you have used the default ?
There are according to you some rule of thumb that I can use to set properly these parameters?
Thank you in advance,
DP
HI,
An additional question: how I have to set my dataset in order to use the apriori algorithm?
Do you think that a dataset like that below should be ok?
ID Product
1 A
1 A
1 B
2 C
2 A
Thanks,
DP
Excellent article, thank you sir ! 🙂
Hi,
there is the solution: it works perfectly
plot(rules,method=”graph”,interactive=TRUE,shading=T)
United we stand
Hi Salem,
I’m trying to mine association rules on a 20,000 transactions dataset. When I try to get the item frequency plot I got this message:
Errore in (function (classes, fdef, mtable) :
unable to find an inherited method for function ‘itemFrequencyPlot’ for signature ‘”matrix”’
Could you help me please?
Tania
You’ll have to convert your data frame into a transactions object.
with something like this:
trans <- as(df, "transactions")
itemFrequencyPlot(trans,topN=20,type="absolute")
Please advise on how to use my own csv file for such an analysis. Someone pls mail me the code. urgent
Great blog. I used apriori to generate rules. How Can i apply the rules to new dataset to predict RHS?
This is just to help people who are using csv files
use read.transactions() than read.csv() for the reason that read.csv() would return data frame with automatic column names
Using MyData<-read.csv() would return data frame in MyData but now when you pass this MyData to apriori, it will accept it but give the column names as V1 , V2 and the result will be distorted
hence use MyData<- read.transactions()
In the above example Groceries is already transaction data
Hence there was no confusion but when importing transactions from csv file, remember the above rules
I was myself facing the problem when I came through this post
https://prdeepakbabu.wordpress.com/2010/11/13/market-basket-analysisassociation-rule-mining-using-r-package-arules/
Hope it helps
FYI:: If you don’t include [shading=N] option then you may skip the error [object ‘v.color’ not found] .
Is there a way to extract how my records are there for each rule? For ex: if
A+ B ===> C
Is there is a way to figure out from the Apriori algorithm how many transactions are there in the rule set? Thanks!
Hi Salem,
I was wondering how I need to structure my data to begin with. Would it be:
Order_ID Products
1 Banana, Milk, Coffee
2 Banana, Oragnge, Milk, Tea
3 Tea, Milk ,Coffee
Then save this as a csv? Then Import it to using the read.transaction() ? Just need some help organizing my own data so I can get started.
Thank you!!!!
Salem
Did you ever figure out what the fix is for the code?
> plot(rules,method=’graph’,interactive=TRUE,shading=NA)
Returns:
Error in i.parse.plot.params(graph, list(…)) :
object ‘v.color’ not found
> plot(rules,method=’graph’,interactive=TRUE)
Returns:
Error in structure(.External(.C_dotTclObjv, objv), class = “tclObj”) :
[tcl] invalid command name “font”.
I followed the rest of your blog post identically, It’s incredible. The only thing is i am stuck on this error.
Help here would be Extremely appreciated.
Have implemented fp growth algorithm in R.I am working on that but didnt find any function like apriori(),eclat()….. Thank you for ur responce in advance.
Hi,
Thanks for this great article!
Here I have a question about the dataset. Is the data from real scenario or you simulated them? And do you mind to give me some info about how can I get the the real scenario data for grocery store purchase records? I am doing a project about this and if there are some data comes from the real scenario I can use, that would be so helpful.
Thanks for any advice!
Cheers,
Yusheng
Hi Salem,
Can you help me in finding a source which explains MBA using FP Growth algorithm ?
I couldn’t find the below link useful.
http://en.wikibooks.org/wiki/Data_Mining_Algorithms_In_R/Frequent_Pattern_Mining/The_FP-Growth_Algorithm
arules package really helps for products, customers, marketing analysis… Just wonder where can I get the data of customers’ orders to analyse? (=.=)”
You made this quite simple to grasp and immediately implement. Thank you!
Hi Salem,
Thanks for the article.
I have a question, which is the better method to do recommendations, market basket analysis or collaborative filtering ?
What is the difference between these two?
Could you help me please?
Thank You
Pingback: ã€å•†æˆ˜ã€‘与ã€ç½‘络大数æ®æŒ–掘】 | Ryo Eng ®
A great post indeed. Hi Salem, would like to get your e-mail id. Please share me your mail id at abinash.stat@gmail.com
Hi Saleem,
I have a transaction data, how can i convert it to the format to be given to affinity analysis??
Pingback: R studio | cl4assignments
hi,
In my data set there are 14 columns.but only one column is string value(fruit value),remaining columns are numeric(temperature , ph values),when i perform apriori i get only numbers in both lhr and rhs(ph ,temperature values.i didn’t get any fruit name).i want fruit name in lhr side.
could you help me please!
Super blog
You save me a banch of time during my class assignment…
thanks
Your method of explaining everything inn this paragraph
is actually good, all be capable of without difficulty
be aware oof it, Thanks a lot.